STEM_MATCS_BTC_STRATEGYAs promised here is the strategy for using STEM and MATCS.
The line of code for the buy and sell signals are bare bones. You will even notice that the ATR_CS is not being included in the logic for the buy/sell signals, which causes the ATR fine tuning not to function.
I am presenting the code in this way because I want to encourage people to explore their own ideas, choose the asset they want to trade and put their own personal touch to the buy/sell signal logic. This is where the magic happens and this is where you can learn how to code if you have not done so in your life.. because I guarantee if you have an idea I am sure there is some way you can massage that idea into the code.
Good luck and have fun, that's what is most important. If you are not having fun please do not trade, find a reputable financial advisory and protect your capital.
**** 1. Never trade with money you cannot afford to lose 2. Never take a trade that is risking more than 10% of your account.
Komut dosyalarını "buy sell" için ara

REAL STRATEGY : Dow_Factor_MFI/RSI_DVOG_StrategyI'm actually one of those who think it's more important to extract clues from indicators than strategy, but I wanted to test the data about the probability and dow factor I've shared for a long time.
Usually, Bitcoin is used as an eye stain for strategy success, since the graph has increased significantly from the beginning.
To prevent this, I used a commission and in the last lines of document I shared Bitmex's Bitcoin and Ethereum 1W test results.
I don't think there's a factor to repaint. ( Warn me if u see or observe )
I considered Bitcoin because I found working with liquid parities much more realistic.
Ethereum and Bitmex have been featured as a spot and may soon find a place at the CME , so I've evaluated the Ethereum .
But since the Ethereum Bitmex was also spot new, I deleted results that were less than 10 closed trades.
Since the Dow Theory also looks at the harmony in the indices, just try it in the Cryptocurrency market.
Use as indicator in other markets. Support with channels, trend lines with big periods and other supportive indicators.
And my personal suggestion : Use this script and indicator TF : 4H and above.
Specifications :
Commission. ( % 0.125 )
Switchable Methods ( Relative Strength Index / Money Flow Index )
Alarms. (Buy / Sell )
Position closure when horizontal market rates weighs.
Progressive gradual buy/sell alarms.
Clean code layout that will not cause repaint. (Caution : source = close )
Switchable barcolor option (I / 0 )
*****Test results :*****
drive.google.com
Summary:
It was a realistic test.
It has achieved great success in some markets, but as I mentioned earlier, use it only to gain insight into the price movements of cryptos.
Use as indicator in other markets.
This code is open source under the MIT license. If you have any improvements or corrections to suggest, please send me a pull request via the github repository : github.com
Stay tuned ! Noldo.

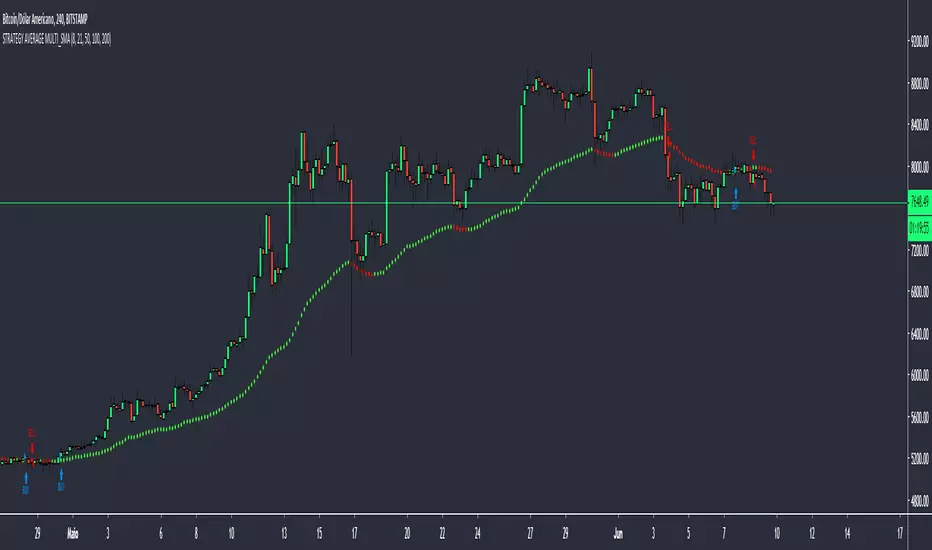
STRATEGY AVERAGE MULTI_SMAThis strategy is based on my script "AVERAGE MULTI_SMA"
The strategy is based on the created media, giving BUY signal when the price closes above the average and the average is rising. For the SELL signal the price closes below the average with the average falling.
For those who are interested in how the "AVERAGE MULTI_SMA" script works, I ask you to analyze it there, because I explain how it works.
Please do not use the indicator as the only factor to do your operations, try to use more as a study.
____PTBR_____
Essa estrategia é baseada no meu script "AVERAGE MULTI_SMA"
A estrategia é baseada na media criada, para o sinal de compra(BUY) o preço fecha acima da média e a média está subindo. Para o sinal de venda(SELL) o preço fecha abaixo da média e a média caindo.
Para quem se interessar em saber como funciona o script "AVERAGE MULTI_SMA", peço que analise ele lá, pois explico como funciona.
Peço que não use o indicador como único fator para fazer suas operações, tente usar mais como um estudo.
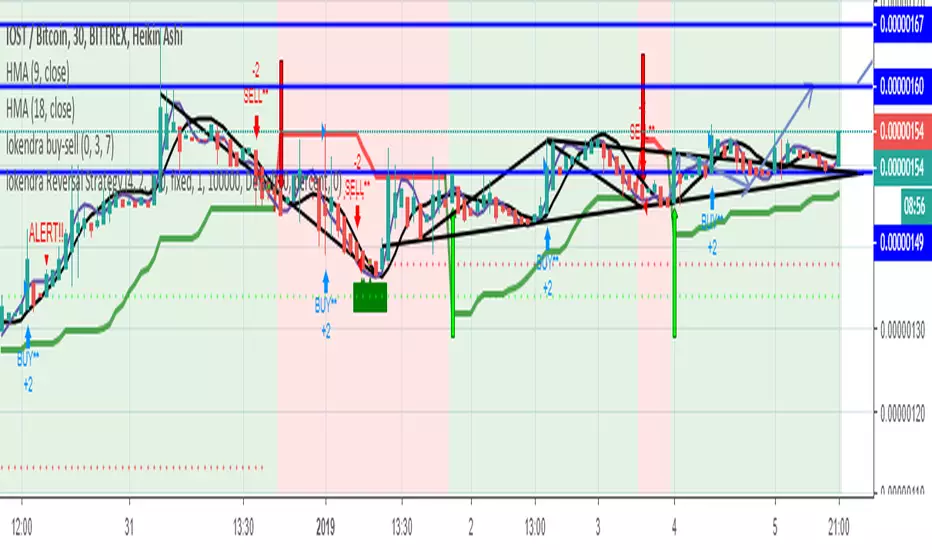
lokendra Revert-Strategythis reversal strategy is to be used with hull moving average (9,18) with each intersection shows the the buy-sell point which will give more accuracy when my reversal strategy give candle turning point towards the change of trend indication by showing buy sell point
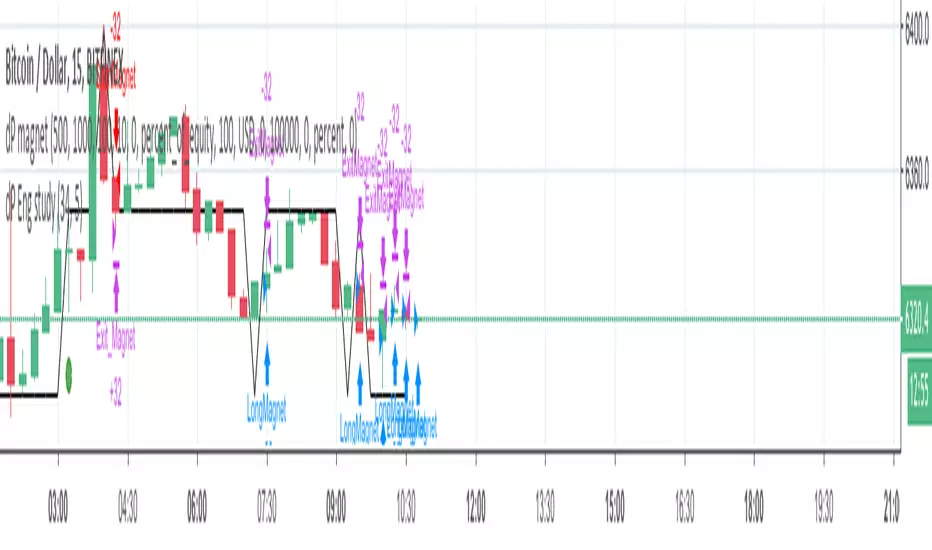
dP magnet//Strategy based on the idea that stop loss and take profit are often placed at full price levels or round numbers, whcih acts as resistance and supports levels
//Buy Rules:
//Actual price (close) is above round number.
//Round number level was not touched in previous ten bars (arbitrary value).
//Place a buy and follow the order with a trail step because price can bounce at round number (support) or can go through it.
//Sell Rules are the same of buy rules but inverted.
//
//Need improvement on conditions' logic and round numbers definitions
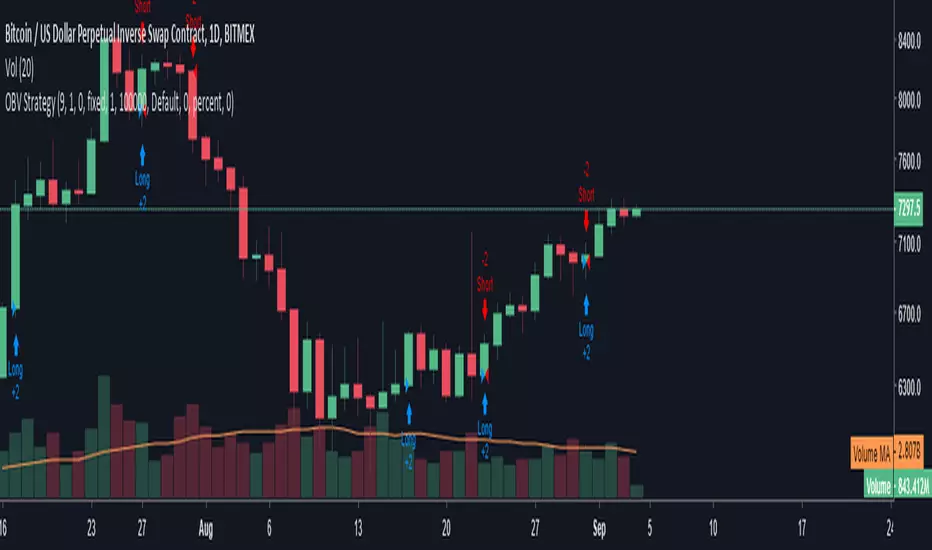
OBV StrategyA simple strategy to give buy/sell signals based on OBV and EMA crossover/crossunder.
When OBV crossunder the EMA it gives a sell signal. When OBV crossover EMA it gives a buy signal.
You can adjust the length of the EMA . By default it is set to 9
TrapTradingBuy on dips and sell into rallies. Simple as that.
- Short line (green)
- Base line (white)
- Long line (red)
When the market price touches the white or the red(green) lines, buy(sell) orders are generated.
The exit points are 2 lines above(below) the entries.
Parameters
- Period: It affects the value of Base line and the spacing of each line.
- Multiple: Specify the spacing between each line.

MACD + RSI + EMA + SMA + Ichimoku + overbought + buy, sell +Doji// MACD + EMA 200 *** buy and sell strategy (RSI, EMA, SMA) *** Doji Harami *** overbought and oversold *** trend direction *** divergence *** Ichimoku
Use this script in time 1h
XPloRR MA-Buy ATR-Trailing-Stop Long Term Strategy Beating B&HXPloRR MA-Buy ATR-MA-Trailing-Stop Strategy
Long term MA Trailing Stop strategy to beat Buy&Hold strategy
None of the strategies that I tested can beat the long term Buy&Hold strategy. That's the reason why I wrote this strategy.
Purpose: beat Buy&Hold strategy with around 10 trades. 100% capitalize sold trade into new trade.
My buy strategy is triggered by the EMA(blue) crossing over the SMA curve(orange).
My sell strategy is triggered by another EMA(lime) of the close value crossing the trailing stop(green) value.
The trailing stop value(green) is set to a multiple of the ATR(15) value.
ATR(15) is the SMA(15) value of the difference between high and low values.
Every stock has it's own "DNA", so first thing to do is find the right parameters to get the best strategy values voor EMA, SMA and Trailing Stop.
Then keep using these parameter for future buy/sell signals only for that particular stock.
Do the same for other stocks.
Here are the parameters:
Exponential MA: buy trigger when crossing over the SMA value (use values between 11-50)
Simple MA: buy trigger when EMA crosses over the SMA value (use values between 20 and 200)
Stop EMA: sell trigger when Stop EMA of close value crosses under the trailing stop value (use values between 8 and 16)
Trailing Stop #ATR: defines the trailing stop value as a multiple of the ATR(15) value
Example parameters for different stocks (Start capital: 1000, Order=100% of equity, Period 1/1/2005 to now):
BAR(Barco): EMA=11, SMA=82, StopEMA=12, Stop#ATR=9
Buy&HoldProfit: 45.82%, NetProfit: 294.7%, #Trades:8, %Profit:62.5%, ProfitFactor: 12.539
AAPL(Apple): EMA=12, SMA=45, StopEMA=12, Stop#ATR=6
Buy&HoldProfit: 2925.86%, NetProfit: 4035.92%, #Trades:10, %Profit:60%, ProfitFactor: 6.36
BEKB(Bekaert): EMA=12, SMA=42, StopEMA=12, Stop#ATR=7
Buy&HoldProfit: 81.11%, NetProfit: 521.37%, #Trades:10, %Profit:60%, ProfitFactor: 2.617
SOLB(Solvay): EMA=12, SMA=63, StopEMA=11, Stop#ATR=8
Buy&HoldProfit: 43.61%, NetProfit: 151.4%, #Trades:8, %Profit:75%, ProfitFactor: 3.794
PHIA(Philips): EMA=11, SMA=80, StopEMA=8, Stop#ATR=10
Buy&HoldProfit: 56.79%, NetProfit: 198.46%, #Trades:6, %Profit:83.33%, ProfitFactor: 23.07
I am very curious to see the parameters for your stocks and please make suggestions to improve this strategy.

EMA StrategyThis strategy is in testing and development.
**USE AT YOUR OWN RISK. **
This defaults to a 13/48 EMA using the closing price. When the fast EMA crosses above the slow it triggers a buy. When it crosses below the slow EMA it triggers a sell and potentially a short, but that is not implemented. Stops, trailing stops, and pyramiding to be added. The purpose of this strategy is to signal recommended entry and exit point and back test whether the strategy works. It is not intended to be an automated buy/sell script.
* stop loss added. Not yet configurable from the settings panel. Defaults to 8% from the entry price.
TODO:
Add the ability to configure the stop-loss level in the settings panel
Add trailing stop functionality
Add profit taking, likely configurable sell targets (2:1 risk to reward gain for example)
Add another signal or two to help improve odds of making a winning trade.

Gold/Silver 30m Only Strategy Buy/Sell SignalsIn my free time I felt like coding this strategy, and after backtesting it, it appears that the 30m time frame is the most profitable.
I only have been working on it for gold, but it should work similarly for silver as well.
This includes no pyramiding, and with pyramiding orders of 5, this strategy is upwards of 100% profitable.
Buy order - when price is above the 162 day EMA and RSI is less than 35
Sell order - when price is below the 162 day EMA and RSI is greater than 65
I will probably be adjusting it to increase the profitability and %success rate.

[STRATEGY][UL]QQE Cross v1.1Updated by request: this is a "Strategy" trading version of the "QQE Cross Indicator Alert v2.0 by JustUncleL" (which is mainly for Binary Options trading), the same BUY/SELL signals are used to generate trade entry and exit conditions. Thanks again to JayRogers for making the Strategy risk management easier to understand and implement.
In this update I have added "Take Profit" option and cleaned up the risk management code. Also changed the close BUY/SELL order if EMA20 direction changes rather the next BUY/SELL opposite signal, making the close earlier.
BE ADVISED TO USE AT YOUR OWN RISK, even though back testing has shown good results, I don't have any Forex trading account to forward test against. You need to perform these test yourself and get back to me if there is any issues.

MACDouble + RSI (rec. 15min-2hr intrv) Uses two sets of MACD plus an RSI to either long or short. All three indicators trigger buy/sell as one (ie it's not 'IF MACD1 OR MACD2 OR RSI > 1 = buy", its more like "IF 1 AND 2 AND RSI=buy", all 3 match required for trigger)
The MACD inputs should be tweaked depending on timeframe and what you are trading. If you are doing 1, 3, 5 min or real frequent trading then 21/44/20 and 32/66/29 or other high value MACDs should be considered. If you are doing longer intervals like 2, 3, 4hr then consider 9/19/9 and 21/44/20 for MACDs (experiment! I picked these example #s randomly).
Ideal usage for the MACD sets is to have MACD2 inputs at around 1.5x, 2x, or 3x MACD1's inputs.
Other settings to consider: try having fastlength1=macdlength1 and then (fastlength2 = macdlength2 - 2). Like 10/26/10 and 23/48/20. This seems to increase net profit since it is more likely to trigger before major price moves, but may decrease profitable trade %. Conversely, consider FL1=MCDL1 and FL2 = MCDL2 + (FL2 * 0.5). Example: 10/26/10 and 22/48/30 this can increase profitable trade %, though may cost some net profit.
Feel free to message me with suggestions or questions.

ISM Indicator As a Strategy Here's a very easy code, plotting the ISM against the SPX. In this exercise, i wanted to see if one could use the ISM indicator only to generate buy/sell signal, and what would be the performance.
What is the ISM
The ISM Manufacturing Index monitors employment, production inventories, new orders and supplier deliveries.By monitoring the ISM Manufacturing Index, investors are able to better understand national economic conditions. When this index is increasing, investors can assume that the stock markets should increase because of higher corporate profits. The opposite can be thought of the bond markets, which may decrease as the ISM Manufacturing Index increases because of sensitivity to potential inflation.
Buy/Sell Signal
ISM above 50 usually good economic condition and vice versa when below 50 . For this code I used 48.50 as my buy/sell signal line.
Results
To test this on a longer time period, I use the SPX index instead of SPY. The results are surprisingly good. 76.92% profitability with 3.03 profit factor.
Conclusion
Investors could use the ISM with other indicators to determine better entry and exit point. I will see if combining the ISM with other custom indicators , could generate better result. Feel free to share your results here.
Cheers
Algo.

TrendMaster Pro 2.3 with Alerts
Hello friends,
A member of the community approached me and asked me how to write an indicator that would achieve a particular set of goals involving comprehensive trend analysis, risk management, and session-based trading controls. Here is one example method of how to create such a system:
Core Strategy Components
Multi-Moving Average System - Uses configurable MA types (EMA, SMA, SMMA) with short-term (9) and long-term (21) periods for primary signal generation through crossovers
Higher Timeframe Trend Filter - Optional trend confirmation using a separate MA (default 50-period) to ensure trades align with broader market direction
Band Power Indicator - Dynamic high/low bands calculated using different MA types to identify price channels and volatility zones
Advanced Signal Filtering
Bollinger Bands Volatility Filter - Prevents trading during low-volatility ranging markets by requiring sufficient band width
RSI Momentum Filter - Uses customizable thresholds (55 for longs, 45 for shorts) to confirm momentum direction
MACD Trend Confirmation - Ensures MACD line position relative to signal line aligns with trade direction
Stochastic Oscillator - Adds momentum confirmation with overbought/oversold levels
ADX Strength Filter - Only allows trades when trend strength exceeds 25 threshold
Session-Based Trading Management
Four Trading Sessions - Asia (18:00-00:00), London (00:00-08:00), NY AM (08:00-13:00), NY PM (13:00-18:00)
Individual Session Limits - Separate maximum trade counts for each session (default 5 per session)
Automatic Session Closure - All positions close at specified market close time
Risk Management Features
Multiple Stop Loss Options - Percentage-based, MA cross, or band-based SL methods
Risk/Reward Ratio - Configurable TP levels based on SL distance (default 1:2)
Auto-Risk Calculation - Dynamic position sizing based on dollar risk limits ($150-$250 range)
Daily Limits - Stop trading after reaching specified TP or SL counts per day
Support & Resistance System
Multiple Pivot Types - Traditional, Fibonacci, Woodie, Classic, DM, and Camarilla calculations
Flexible Timeframes - Auto-adjusting or manual timeframe selection for S/R levels
Historical Levels - Configurable number of past S/R levels to display
Visual Customization - Individual color and display settings for each S/R level
Additional Features
Alert System - Customizable buy/sell alert messages with once-per-bar frequency
Visual Trade Management - Color-coded entry, SL, and TP levels with fill areas
Session Highlighting - Optional background colors for different trading sessions
Comprehensive Filtering - All signals must pass through multiple confirmation layers before execution
This approach demonstrates how to build a professional-grade trading system that combines multiple technical analysis methods with robust risk management and session-based controls, suitable for algorithmic trading across different market sessions.
Good luck and stay safe!

Multi-Indicator Trend-Following Strategy v6Multi-Indicator Trend-Following Strategy v6
This strategy uses a combination of technical indicators to identify potential trend-following trade entries and exits. It is intended for educational and research purposes.
How it works:
Moving Averages (EMA): Entry signals are generated on crossovers between a fast and slow exponential moving average.
RSI Filter: Confirms momentum with a threshold above/below 50 for long/short entries.
Volume Confirmation: Requires volume to exceed a moving average multiplied by a user-defined factor.
ATR-Based Risk Management: Stop loss and take profit levels are calculated using the Average True Range (ATR), allowing for dynamic risk control based on market volatility.
Customizable Inputs:
Fast/Slow MA lengths
RSI length and levels
MACD settings (used in calculation, not directly in signal)
Volume MA and multiplier
ATR period and multipliers for stop loss and take profit
Notes:
This strategy does not guarantee future results.
It is provided for analysis and backtesting only.
Alerts are available for buy/sell conditions.
Feel free to adjust parameters to explore different market conditions and asset classes.

Hammer + EMA Strategy with Tick-based SL/TPWhat This Script Does:
Detects Hammer (bullish reversal) and Inverted Hammer (bearish reversal) patterns
Requires a simple trend context (using 2 bars back)
Confirms price position relative to EMA 50
Applies tick-based SL and TP
Plots buy/sell signals on chart with emoji labels

Kaito Box with RSI Div(Dynamic Adjustment + MA + Long)The script implements a dynamic trading strategy that combines box range detection, RSI divergence signals, and moving average trend analysis. It is designed for use on OKX Signal Bots and includes features for dynamic position scaling and partial position closing. Below is a summary of its key functionalities:
Key Features:
Box Range Detection:
The script identifies price ranges using the highest high and lowest low of a configurable boxLength period.
These levels are plotted on the chart to visualize the price range.
RSI Divergence Detection:
The script calculates RSI using a configurable rsiLength.
Detects bullish divergence when price makes a lower low, but RSI makes a higher low.
Detects bearish divergence when price makes a higher high, but RSI makes a lower high.
Includes separate left and right lookback periods (leftLookback, rightLookback) for precise local extrema detection.
Customizable Moving Averages:
Supports multiple types of Moving Averages (SMA, EMA, SMMA, WMA, VWMA).
Calculates and plots MA20, MA50, MA100, and MA200 on a user-defined timeframe (custom_timeframe).
Identifies uptrends and downtrends based on the alignment of the moving averages and price levels.
Dynamic Position Scaling:
Implements dynamic position sizing for long entries and partial position closing for exits.
The percentage of position size added or closed is based on the difference between the current price and the average position price (avgPrice), with configurable minimum thresholds (minEnterPercent, minExitPercent).
Signal Integration for OKX Bots:
Sends buy/sell signals to OKX Signal Bots using the configured signalToken.
Supports market or limit orders with configurable price offsets and investment types.
Trend-Based Signal Filtering:
Only triggers long signals during downtrends and short signals during uptrends, ensuring trades align with the overall market context.
Visual Annotations:
Plots bullish and bearish divergence signals on the chart.
Displays labels showing dynamic position size adjustments and current average price during trades.
How It Works:
Long Signals:
Triggered when the price breaches the lower box range, and a bullish RSI divergence is detected.
Additional filtering ensures long trades are executed only during downtrend conditions.
Dynamically adjusts the position size based on the price difference from the average entry price.
Short Signals:
Triggered when the price breaches the upper box range, and a bearish RSI divergence is detected.
Additional filtering ensures short trades are executed only during uptrend conditions.
Dynamically closes portions of the position based on price movement relative to the average entry price.
Alerts:
Generates actionable alerts formatted for OKX bots, including order type, signal token, and dynamically calculated position sizes.
Use Case:
This strategy is well-suited for automated trading on platforms like OKX, where it can:
Exploit price ranges and RSI divergences for precise entries and exits.
Dynamically manage position sizes to optimize risk-reward.
Adapt to different market conditions using configurable parameters like moving averages, divergence lookbacks, and trend filters.
This script provides a robust foundation for traders looking to automate their strategies while maintaining flexibility and control over their trading logic.

Dskyz (DAFE) Adaptive Regime - Quant Machine ProDskyz (DAFE) Adaptive Regime - Quant Machine Pro:
Buckle up for the Dskyz (DAFE) Adaptive Regime - Quant Machine Pro, is a strategy that’s your ultimate edge for conquering futures markets like ES, MES, NQ, and MNQ. This isn’t just another script—it’s a quant-grade powerhouse, crafted with precision to adapt to market regimes, deliver multi-factor signals, and protect your capital with futures-tuned risk management. With its shimmering DAFE visuals, dual dashboards, and glowing watermark, it turns your charts into a cyberpunk command center, making trading as thrilling as it is profitable.
Unlike generic scripts clogging up the space, the Adaptive Regime is a DAFE original, built from the ground up to tackle the chaos of futures trading. It identifies market regimes (Trending, Range, Volatile, Quiet) using ADX, Bollinger Bands, and HTF indicators, then fires trades based on a weighted scoring system that blends candlestick patterns, RSI, MACD, and more. Add in dynamic stops, trailing exits, and a 5% drawdown circuit breaker, and you’ve got a system that’s as safe as it is aggressive. Whether you’re a newbie or a prop desk pro, this strat’s your ticket to outsmarting the markets. Let’s break down every detail and see why it’s a must-have.
Why Traders Need This Strategy
Futures markets are a gauntlet—fast moves, volatility spikes (like the April 28, 2025 NQ 1k-point drop), and institutional traps that punish the unprepared. Meanwhile, platforms are flooded with low-effort scripts that recycle old ideas with zero innovation. The Adaptive Regime stands tall, offering:
Adaptive Intelligence: Detects market regimes (Trending, Range, Volatile, Quiet) to optimize signals, unlike one-size-fits-all scripts.
Multi-Factor Precision: Combines candlestick patterns, MA trends, RSI, MACD, volume, and HTF confirmation for high-probability trades.
Futures-Optimized Risk: Calculates position sizes based on $ risk (default: $300), with ATR or fixed stops/TPs tailored for ES/MES.
Bulletproof Safety: 5% daily drawdown circuit breaker and trailing stops keep your account intact, even in chaos.
DAFE Visual Mastery: Pulsing Bollinger Band fills, dynamic SL/TP lines, and dual dashboards (metrics + position) make signals crystal-clear and charts a work of art.
Original Craftsmanship: A DAFE creation, built with community passion, not a rehashed clone of generic code.
Traders need this because it’s a complete, adaptive system that blends quant smarts, user-friendly design, and DAFE flair. It’s your edge to trade with confidence, cut through market noise, and leave the copycats in the dust.
Strategy Components
1. Market Regime Detection
The strategy’s brain is its ability to classify market conditions into five regimes, ensuring signals match the environment.
How It Works:
Trending (Regime 1): ADX > 20, fast/slow EMA spread > 0.3x ATR, HTF RSI > 50 or MACD bullish (htf_trend_bull/bear).
Range (Regime 2): ADX < 25, price range < 3% of close, no HTF trend.
Volatile (Regime 3): BB width > 1.5x avg, ATR > 1.2x avg, HTF RSI overbought/oversold.
Quiet (Regime 4): BB width < 0.8x avg, ATR < 0.9x avg.
Other (Regime 5): Default for unclear conditions.
Indicators: ADX (14), BB width (20), ATR (14, 50-bar SMA), HTF RSI (14, daily default), HTF MACD (12,26,9).
Why It’s Brilliant:
Regime detection adapts signals to market context, boosting win rates in trending or volatile conditions.
HTF RSI/MACD add a big-picture filter, rare in basic scripts.
Visualized via gradient background (green for Trending, orange for Range, red for Volatile, gray for Quiet, navy for Other).
2. Multi-Factor Signal Scoring
Entries are driven by a weighted scoring system that combines candlestick patterns, trend, momentum, and volume for robust signals.
Candlestick Patterns:
Bullish: Engulfing (0.5), hammer (0.4 in Range, 0.2 else), morning star (0.2), piercing (0.2), double bottom (0.3 in Volatile, 0.15 else). Must be near support (low ≤ 1.01x 20-bar low) with volume spike (>1.5x 20-bar avg).
Bearish: Engulfing (0.5), shooting star (0.4 in Range, 0.2 else), evening star (0.2), dark cloud (0.2), double top (0.3 in Volatile, 0.15 else). Must be near resistance (high ≥ 0.99x 20-bar high) with volume spike.
Logic: Patterns are weighted higher in specific regimes (e.g., hammer in Range, double bottom in Volatile).
Additional Factors:
Trend: Fast EMA (20) > slow EMA (50) + 0.5x ATR (trend_bull, +0.2); opposite for trend_bear.
RSI: RSI (14) < 30 (rsi_bull, +0.15); > 70 (rsi_bear, +0.15).
MACD: MACD line > signal (12,26,9, macd_bull, +0.15); opposite for macd_bear.
Volume: ATR > 1.2x 50-bar avg (vol_expansion, +0.1).
HTF Confirmation: HTF RSI < 70 and MACD bullish (htf_bull_confirm, +0.2); RSI > 30 and MACD bearish (htf_bear_confirm, +0.2).
Scoring:
bull_score = sum of bullish factors; bear_score = sum of bearish. Entry requires score ≥ 1.0.
Example: Bullish engulfing (0.5) + trend_bull (0.2) + rsi_bull (0.15) + htf_bull_confirm (0.2) = 1.05, triggers long.
Why It’s Brilliant:
Multi-factor scoring ensures signals are confirmed by multiple market dynamics, reducing false positives.
Regime-specific weights make patterns more relevant (e.g., hammers shine in Range markets).
HTF confirmation aligns with the big picture, a quant edge over simplistic scripts.
3. Futures-Tuned Risk Management
The risk system is built for futures, calculating position sizes based on $ risk and offering flexible stops/TPs.
Position Sizing:
Logic: Risk per trade (default: $300) ÷ (stop distance in points * point value) = contracts, capped at max_contracts (default: 5). Point value = tick value (e.g., $12.5 for ES) * ticks per point (4) * contract multiplier (1 for ES, 0.1 for MES).
Example: $300 risk, 8-point stop, ES ($50/point) → 0.75 contracts, rounded to 1.
Impact: Precise sizing prevents over-leverage, critical for micro contracts like MES.
Stops and Take-Profits:
Fixed: Default stop = 8 points, TP = 16 points (2:1 reward/risk).
ATR-Based: Stop = 1.5x ATR (default), TP = 3x ATR, enabled via use_atr_for_stops.
Logic: Stops set at swing low/high ± stop distance; TPs at 2x stop distance from entry.
Impact: ATR stops adapt to volatility, while fixed stops suit stable markets.
Trailing Stops:
Logic: Activates at 50% of TP distance. Trails at close ± 1.5x ATR (atr_multiplier). Longs: max(trail_stop_long, close - ATR * 1.5); shorts: min(trail_stop_short, close + ATR * 1.5).
Impact: Locks in profits during trends, a game-changer in volatile sessions.
Circuit Breaker:
Logic: Pauses trading if daily drawdown > 5% (daily_drawdown = (max_equity - equity) / max_equity).
Impact: Protects capital during black swan events (e.g., April 27, 2025 ES slippage).
Why It’s Brilliant:
Futures-specific inputs (tick value, multiplier) make it plug-and-play for ES/MES.
Trailing stops and circuit breaker add pro-level safety, rare in off-the-shelf scripts.
Flexible stops (ATR or fixed) suit different trading styles.
4. Trade Entry and Exit Logic
Entries and exits are precise, driven by bull_score/bear_score and protected by drawdown checks.
Entry Conditions:
Long: bull_score ≥ 1.0, no position (position_size <= 0), drawdown < 5% (not pause_trading). Calculates contracts, sets stop at swing low - stop points, TP at 2x stop distance.
Short: bear_score ≥ 1.0, position_size >= 0, drawdown < 5%. Stop at swing high + stop points, TP at 2x stop distance.
Logic: Tracks entry_regime for PNL arrays. Closes opposite positions before entering.
Exit Conditions:
Stop-Loss/Take-Profit: Hits stop or TP (strategy.exit).
Trailing Stop: Activates at 50% TP, trails by ATR * 1.5.
Emergency Exit: Closes if price breaches stop (close < long_stop_price or close > short_stop_price).
Reset: Clears stop/TP prices when flat (position_size = 0).
Why It’s Brilliant:
Score-based entries ensure multi-factor confirmation, filtering out weak signals.
Trailing stops maximize profits in trends, unlike static exits in basic scripts.
Emergency exits add an extra safety layer, critical for futures volatility.
5. DAFE Visuals
The visuals are pure DAFE magic, blending function with cyberpunk flair to make signals intuitive and charts stunning.
Shimmering Bollinger Band Fill:
Display: BB basis (20, white), upper/lower (green/red, 45% transparent). Fill pulses (30–50 alpha) by regime, with glow (60–95 alpha) near bands (close ≥ 0.995x upper or ≤ 1.005x lower).
Purpose: Highlights volatility and key levels with a futuristic glow.
Visuals make complex regimes and signals instantly clear, even for newbies.
Pulsing effects and regime-specific colors add a DAFE signature, setting it apart from generic scripts.
BB glow emphasizes tradeable levels, enhancing decision-making.
Chart Background (Regime Heatmap):
Green — Trending Market: Strong, sustained price movement in one direction. The market is in a trend phase—momentum follows through.
Orange — Range-Bound: Market is consolidating or moving sideways, with no clear up/down trend. Great for mean reversion setups.
Red — Volatile Regime: High volatility, heightened risk, and larger/faster price swings—trade with caution.
Gray — Quiet/Low Volatility: Market is calm and inactive, with small moves—often poor conditions for most strategies.
Navy — Other/Neutral: Regime is uncertain or mixed; signals may be less reliable.
Bollinger Bands Glow (Dynamic Fill):
Neon Red Glow — Warning!: Price is near or breaking above the upper band; momentum is overstretched, watch for overbought conditions or reversals.
Bright Green Glow — Opportunity!: Price is near or breaking below the lower band; market could be oversold, prime for bounce or reversal.
Trend Green Fill — Trending Regime: Fills between bands with green when the market is trending, showing clear momentum.
Gold/Yellow Fill — Range Regime: Fills with gold/aqua in range conditions, showing the market is sideways/oscillating.
Magenta/Red Fill — Volatility Spike: Fills with vivid magenta/red during highly volatile regimes.
Blue Fill — Neutral/Quiet: A soft blue glow for other or uncertain market states.
Moving Averages:
Display: Blue fast EMA (20), red slow EMA (50), 2px.
Purpose: Shows trend direction, with trend_dir requiring ATR-scaled spread.
Dynamic SL/TP Lines:
Display: Pulsing colors (red SL, green TP for Trending; yellow/orange for Range, etc.), 3px, with pulse_alpha for shimmer.
Purpose: Tracks stops/TPs in real-time, color-coded by regime.
6. Dual Dashboards
Two dashboards deliver real-time insights, making the strat a quant command center.
Bottom-Left Metrics Dashboard (2x13):
Metrics: Mode (Active/Paused), trend (Bullish/Bearish/Neutral), ATR, ATR avg, volume spike (YES/NO), RSI (value + Oversold/Overbought/Neutral), HTF RSI, HTF trend, last signal (Buy/Sell/None), regime, bull score.
Display: Black (29% transparent), purple title, color-coded (green for bullish, red for bearish).
Purpose: Consolidates market context and signal strength.
Top-Right Position Dashboard (2x7):
Metrics: Regime, position side (Long/Short/None), position PNL ($), SL, TP, daily PNL ($).
Display: Black (29% transparent), purple title, color-coded (lime for Long, red for Short).
Purpose: Tracks live trades and profitability.
Why It’s Brilliant:
Dual dashboards cover market context and trade status, a rare feature.
Color-coding and concise metrics guide beginners (e.g., green “Buy” = go).
Real-time PNL and SL/TP visibility empower disciplined trading.
7. Performance Tracking
Logic: Arrays (regime_pnl_long/short, regime_win/loss_long/short) track PNL and win/loss by regime (1–5). Updated on trade close (barstate.isconfirmed).
Purpose: Prepares for future adaptive thresholds (e.g., adjust bull_score min based on regime performance).
Why It’s Brilliant: Lays the groundwork for self-optimizing logic, a quant edge over static scripts.
Key Features
Regime-Adaptive: Optimizes signals for Trending, Range, Volatile, Quiet markets.
Futures-Optimized: Precise sizing for ES/MES with tick-based risk inputs.
Multi-Factor Signals: Candlestick patterns, RSI, MACD, and HTF confirmation for robust entries.
Dynamic Exits: ATR/fixed stops, 2:1 TPs, and trailing stops maximize profits.
Safe and Smart: 5% drawdown breaker and emergency exits protect capital.
DAFE Visuals: Shimmering BB fill, pulsing SL/TP, and dual dashboards.
Backtest-Ready: Fixed qty and tick calc for accurate historical testing.
How to Use
Add to Chart: Load on a 5min ES/MES chart in TradingView.
Configure Inputs: Set instrument (ES/MES), tick value ($12.5/$1.25), multiplier (1/0.1), risk ($300 default). Enable ATR stops for volatility.
Monitor Dashboards: Bottom-left for regime/signals, top-right for position/PNL.
Backtest: Run in strategy tester to compare regimes.
Live Trade: Connect to Tradovate or similar. Watch for slippage (e.g., April 27, 2025 ES issues).
Replay Test: Try April 28, 2025 NQ drop to see regime shifts and stops.
Disclaimer
Trading futures involves significant risk of loss and is not suitable for all investors. Past performance does not guarantee future results. Backtest results may differ from live trading due to slippage, fees, or market conditions. Use this strategy at your own risk, and consult a financial advisor before trading. Dskyz (DAFE) Trading Systems is not responsible for any losses incurred.
Backtesting:
Frame: 2023-09-20 - 2025-04-29
Slippage: 3
Fee Typical Range (per side, per contract)
CME Exchange $1.14 – $1.20
Clearing $0.10 – $0.30
NFA Regulatory $0.02
Firm/Broker Commis. $0.25 – $0.80 (retail prop)
TOTAL $1.60 – $2.30 per side
Round Turn: (enter+exit) = $3.20 – $4.60 per contract
Final Notes
The Dskyz (DAFE) Adaptive Regime - Quant Machine Pro is more than a strategy—it’s a revolution. Crafted with DAFE’s signature precision, it rises above generic scripts with adaptive regimes, quant-grade signals, and visuals that make trading a thrill. Whether you’re scalping MES or swinging ES, this system empowers you to navigate markets with confidence and style. Join the DAFE crew, light up your charts, and let’s dominate the futures game!
(This publishing will most likely be taken down do to some miscellaneous rule about properly displaying charting symbols, or whatever. Once I've identified what part of the publishing they want to pick on, I'll adjust and repost.)
Use it with discipline. Use it with clarity. Trade smarter.
**I will continue to release incredible strategies and indicators until I turn this into a brand or until someone offers me a contract.
Created by Dskyz, powered by DAFE Trading Systems. Trade smart, trade bold.

Dkoderweb repainting issue fix strategyHarmonic Pattern Recognition Trading Strategy
This TradingView strategy called "Dkoderweb repainting issue fix strategy" is designed to identify and trade harmonic price patterns with optimized entry and exit points using Fibonacci levels. The strategy implements various popular harmonic patterns including Bat, Butterfly, Gartley, Crab, Shark, ABCD, and their anti-patterns.
Key Features
Pattern Recognition: Identifies 17+ harmonic price patterns including standard and anti-patterns
Fibonacci-Based Entries and Exits: Uses customizable Fibonacci levels for precision entries, take profits, and stop losses
Alternative Timeframe Analysis: Option to use higher timeframes for pattern identification
Heiken Ashi Support: Optional use of Heiken Ashi candles instead of regular candlesticks
Visual Indicators:
Pattern visualization with ZigZag indicator
Buy/sell signal markers
Color-coded background to highlight active trade zones
Customizable Fibonacci level display
How It Works
The strategy uses a ZigZag-based pattern identification system to detect pivot points
When a valid harmonic pattern forms, the strategy calculates the optimal entry window using the specified Fibonacci level (default 0.382)
Entries trigger when price returns to the entry window after pattern completion
Take profit and stop loss levels are automatically set based on customizable Fibonacci ratios
Visual alerts notify you of entries and exits
The strategy tracks active trades and displays them with background color highlights
Customizable Settings
Trade size
Entry window Fibonacci level (default 0.382)
Take profit Fibonacci level (default 0.618)
Stop loss Fibonacci level (default -0.618)
Alert messages for entries and exits
Display options for specific Fibonacci levels
Alternative timeframe selection
This strategy is designed to fix repainting issues that are common in harmonic pattern strategies, ensuring more reliable signals and backtesting results.

Multi-Timeframe MACD Strategy ver 1.0Multi-Timeframe MACD Strategy: Enhanced Trend Trading with Customizable Entry and Trailing Stop
This strategy utilizes the Moving Average Convergence Divergence (MACD) indicator across multiple timeframes to identify strong trends, generate precise entry and exit signals, and manage risk with an optional trailing stop loss. By combining the insights of both the current chart's timeframe and a user-defined higher timeframe, this strategy aims to improve trade accuracy, reduce exposure to false signals, and capture larger market moves.
Key Features:
Dual Timeframe Analysis: Calculates and analyzes the MACD on both the current chart's timeframe and a user-selected higher timeframe (e.g., Daily MACD on a 1-hour chart). This provides a broader market context, helping to confirm trends and filter out short-term noise.
Configurable MACD: Fine-tune the MACD calculation with adjustable Fast Length, Slow Length, and Signal Length parameters. Optimize the indicator's sensitivity to match your trading style and the volatility of the asset.
Flexible Entry Options: Choose between three distinct entry types:
Crossover: Enters trades when the MACD line crosses above (long) or below (short) the Signal line.
Zero Cross: Enters trades when the MACD line crosses above (long) or below (short) the zero line.
Both: Combines both Crossover and Zero Cross signals, providing more potential entry opportunities.
Independent Timeframe Control: Display and trade based on the current timeframe MACD, the higher timeframe MACD, or both. This allows you to focus on the information most relevant to your analysis.
Optional Trailing Stop Loss: Implements a configurable trailing stop loss to protect profits and limit potential losses. The trailing stop is adjusted dynamically as the price moves in your favor, based on a user-defined percentage.
No Repainting: Employs lookahead=barmerge.lookahead_off in the request.security() function to prevent data leakage and ensure accurate backtesting and real-time signals.
Clear Visual Signals (Optional): Includes optional plotting of the MACD and Signal lines for both timeframes, with distinct colors for easy visual identification. These plots are for visual confirmation and are not required for the strategy's logic.
Suitable for Various Trading Styles: Adaptable to swing trading, day trading, and trend-following strategies across diverse markets (stocks, forex, cryptocurrencies, etc.).
Fully Customizable: All parameters are adjustable, including timeframes, MACD Settings, Entry signal type and trailing stop settings.
How it Works:
MACD Calculation: The strategy calculates the MACD (using the standard formula) for both the current chart's timeframe and the specified higher timeframe.
Trend Identification: The relationship between the MACD line, Signal line, and zero line is used to determine the current trend for each timeframe.
Entry Signals: Buy/sell signals are generated based on the selected "Entry Type":
Crossover: A long signal is generated when the MACD line crosses above the Signal line, and both timeframes are in agreement (if both are enabled). A short signal is generated when the MACD line crosses below the Signal line, and both timeframes are in agreement.
Zero Cross: A long signal is generated when the MACD line crosses above the zero line, and both timeframes agree. A short signal is generated when the MACD line crosses below the zero line and both timeframes agree.
Both: Combines Crossover and Zero Cross signals.
Trailing Stop Loss (Optional): If enabled, a trailing stop loss is set at a specified percentage below (for long positions) or above (for short positions) the entry price. The stop-loss is automatically adjusted as the price moves favorably.
Exit Signals:
Without Trailing Stop: Positions are closed when the MACD signals reverse according to the selected "Entry Type" (e.g., a long position is closed when the MACD line crosses below the Signal line if using "Crossover" entries).
With Trailing Stop: Positions are closed if the price hits the trailing stop loss.
Backtesting and Optimization: The strategy automatically backtests on the chart's historical data, allowing you to assess its performance and optimize parameters for different assets and timeframes.
Example Use Cases:
Confirming Trend Strength: A trader on a 1-hour chart sees a bullish MACD crossover on the current timeframe. They check the MTF MACD strategy and see that the Daily MACD is also bullish, confirming the strength of the uptrend.
Filtering Noise: A trader using a 15-minute chart wants to avoid false signals from short-term volatility. They use the strategy with a 4-hour higher timeframe to filter out noise and only trade in the direction of the dominant trend.
Dynamic Risk Management: A trader enters a long position and enables the trailing stop loss. As the price rises, the trailing stop is automatically adjusted upwards, protecting profits. The trade is exited either when the MACD reverses or when the price hits the trailing stop.
Disclaimer:
The MACD is a lagging indicator and can produce false signals, especially in ranging markets. This strategy is for educational and informational purposes only and should not be considered financial advice. Backtest and optimize the strategy thoroughly, combine it with other technical analysis tools, and always implement sound risk management practices before using it with real capital. Past performance is not indicative of future results. Conduct your own due diligence and consider your risk tolerance before making any trading decisions.

Multi-Timeframe Parabolic SAR Strategy ver 1.0Multi-Timeframe Parabolic SAR Strategy (MTF PSAR) - Enhanced Trend Trading
This strategy leverages the power of the Parabolic SAR (Stop and Reverse) indicator across multiple timeframes to provide robust trend identification, precise entry/exit signals, and dynamic trailing stop management. By combining the insights of both the current chart's timeframe and a user-defined higher timeframe, this strategy aims to improve trading accuracy, reduce risk, and capture more significant market moves.
Key Features:
Dual Timeframe Analysis: Simultaneously analyzes the Parabolic SAR on the current chart and a higher timeframe (e.g., Daily PSAR on a 1-hour chart). This allows you to align your trades with the dominant trend and filter out noise from lower timeframes.
Configurable PSAR: Fine-tune the PSAR calculation with adjustable Start, Increment, and Maximum values to optimize sensitivity for your trading style and the asset's volatility.
Independent Timeframe Control: Choose to display and trade based on either or both the current timeframe PSAR and the higher timeframe PSAR. Focus on the most relevant information for your analysis.
Clear Visual Signals: Distinct colors for the current and higher timeframe PSAR dots provide a clear visual representation of potential entry and exit points.
Multiple Entry Strategies: The strategy offers flexible entry conditions, allowing you to trade based on:
Confirmation: Both current and higher timeframe PSAR signals agree and the current timeframe PSAR has just flipped direction. (Most conservative)
Current Timeframe Only: Trades based solely on the current timeframe PSAR, ideal for when the higher timeframe is less relevant or disabled.
Higher Timeframe Only: Trades based solely on the higher timeframe PSAR.
Dynamic Trailing Stop (PSAR-Based): Implements a trailing stop-loss based on the current timeframe's Parabolic SAR. This helps protect profits by automatically adjusting the stop-loss as the price moves in your favor. Exits are triggered when either the current or HTF PSAR flips.
No Repainting: Uses lookahead=barmerge.lookahead_off in the security() function to ensure that the higher timeframe data is accessed without any data leakage, preventing repainting issues.
Fully Configurable: All parameters (PSAR settings, higher timeframe, visibility, colors) are adjustable through the strategy's settings panel, allowing for extensive customization and optimization.
Suitable for Various Trading Styles: Applicable to swing trading, day trading, and trend-following strategies across various markets (stocks, forex, cryptocurrencies, etc.).
How it Works:
PSAR Calculation: The strategy calculates the standard Parabolic SAR for both the current chart's timeframe and the selected higher timeframe.
Trend Identification: The direction of the PSAR (dots below price = uptrend, dots above price = downtrend) determines the current trend for each timeframe.
Entry Signals: The strategy generates buy/sell signals based on the chosen entry strategy (Confirmation, Current Timeframe Only, or Higher Timeframe Only). The Confirmation strategy offers the highest probability signals by requiring agreement between both timeframes.
Trailing Stop Exit: Once a position is entered, the strategy uses the current timeframe PSAR as a dynamic trailing stop. The stop-loss is automatically adjusted as the PSAR dots move, helping to lock in profits and limit losses. The strategy exits when either the Current or HTF PSAR changes direction.
Backtesting and Optimization: The strategy automatically backtests on the chart's historical data, allowing you to evaluate its performance and optimize the settings for different assets and timeframes.
Example Use Cases:
Trend Confirmation: A trader on a 1-hour chart observes a bullish PSAR flip on the current timeframe. They check the MTF PSAR strategy and see that the Daily PSAR is also bullish, confirming the strength of the uptrend and providing a high-probability long entry signal.
Filtering Noise: A trader on a 5-minute chart wants to avoid whipsaws caused by short-term price fluctuations. They use the strategy with a 1-hour higher timeframe to filter out noise and only trade in the direction of the dominant trend.
Dynamic Risk Management: A trader enters a long position and uses the current timeframe PSAR as a trailing stop. As the price rises, the PSAR dots move upwards, automatically raising the stop-loss and protecting profits. The trade is exited when the current (or HTF) PSAR flips to bearish.
Disclaimer:
The Parabolic SAR is a lagging indicator and can produce false signals, particularly in ranging or choppy markets. This strategy is intended for educational and informational purposes only and should not be considered financial advice. It is essential to backtest and optimize the strategy thoroughly, use it in conjunction with other technical analysis tools, and implement sound risk management practices before using it with real capital. Past performance is not indicative of future results. Always conduct your own due diligence and consider your risk tolerance before making any trading decisions.

Adaptive Fractal Grid Scalping StrategyThis Pine Script v6 component implements an "Adaptive Fractal Grid Scalping Strategy" with an added volatility threshold feature.
Here's how it works:
Fractal Break Detection: Uses ta.pivothigh and ta.pivotlow to identify local highs and lows.
Volatility Clustering: Measures volatility using the Average True Range (ATR).
Adaptive Grid Levels: Dynamically adjusts grid levels based on ATR and user-defined multipliers.
Directional Bias Filter: Uses a Simple Moving Average (SMA) to determine trend direction.
Volatility Threshold: Introduces a new input to specify a minimum ATR value required to activate the strategy.
Trade Execution Logic: Places limit orders at grid levels based on trend direction and fractal levels, but only when ATR exceeds the volatility threshold.
Profit-Taking and Stop-Loss: Implements profit-taking at grid levels and a trailing stop-loss based on ATR.
How to Use
Inputs: Customize the ATR length, SMA length, grid multipliers, trailing stop multiplier, and volatility threshold through the input settings.
Visuals: The script plots fractal points and grid levels on the chart for easy visualization.
Trade Signals: The strategy automatically places buy/sell orders based on the detected fractals, trend direction, and volatility threshold.
Profit and Risk Management: The script includes logic for taking profits and setting stop-loss levels to manage trades effectively.
This strategy is designed to capitalize on micro-movements during high volatility and avoid overtrading during low-volatility trends. Adjust the input parameters to suit your trading style and market conditions.
